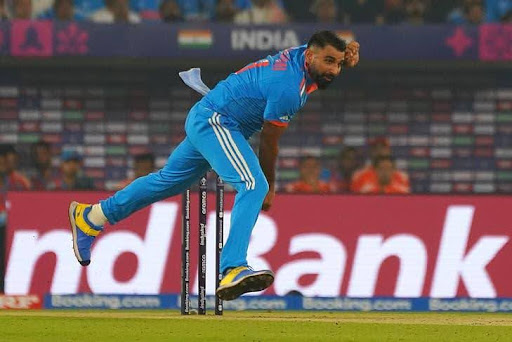
Analysis: In five of the eight games, India bowled out teams batting below 200

In this World Cup, India’s bowlers have given them an air of invincibility while they are one of only two teams not to have given up a total of 300 or more in a series where 350 has been surpassed 11 times. In this World Cup, India’s bowlers have given them an air of invincibility. They are one of only two teams not to have given up a total of 300 or more in a series where 350 has been surpassed 11 times. In five of the eight games, India bowled out teams batting below 200. There have been two totals below 100. Although their batters have outperformed all others in terms of batting average, the World Cup has been true to its period and the sport itself, with the odds stacked more in favor of the batter than the bowler. And like few before them, India’s bowlers have performed in ways that beat those odds. India’s bowlers have averaged 19.02 at an economy of 4.40 in a World Cup where bowlers have taken a wicket every 34.39 runs on average and conceded runs at a rate of 5.73 per over. That is the amount of lead India has had with the ball over the pitch. South Africa has been the second-best bowling team in this World Cup based on average. Their bowlers have an average of 26.01 and have claimed 72 wickets. India’s 75 wickets have come at a cost of about 7 runs each. BEST BY A MILE TOP GAPS BETWEEN THE BEST AND 2ND-BEST BOWLING AVERAGES IN AN ODI WORLD CUP World Cup Best Team Best Ave 2nd-Best Team 2nd-Best Ave Diff 2023 INDIA 19.03 SOUTH AFRICA 26.01 −6.99 2003 AUSTRALIA 18.33 INDIA 23.56 −5.23 2007 AUSTRALIA 19.57 SRI LANKA 23.64 −4.08 2011 SOUTH AFRICA 18.80 PAKISTAN 21.91 −3.11 2015 AUSTRALIA 21.29 INDIA 23.99 −2.70 Similarly, India has the best economy in this World Cup with 4.40 runs per over. India has allowed 0.86 runs per over less than the second-place team, Afghanistan. No team in any World Cup series has outperformed the next best by as much as India has done in this one among those that have thrown down at least 300 overs. STRANGLE, UNRIVALLED BIGGEST GAPS BETWEEN THE BEST AND 2ND-BEST BOWLING ECONOMY IN AN ODI WORLD CUP World Cup Best team Best Eco 2nd-Best team 2nd-best Eco Diff 2023 INDIA 4.40 AFGHANISTAN 5.27 −0.86 2011 PAKISTAN 4.13 SRI LANKA 4.44 −0.32 2019 NEW ZEALAND 4.90 ENGLAND 5.12 −0.22 1987 INDIA 4.20 PAKISTAN 4.39 −0.19

